Welcome to ...

The place where the world comes together in honesty and mirth.
Windmills Tilted, Scared Cows Butchered, Lies Skewered on the Lance of Reality ... or something to that effect.


Thursday, June 25, 2015

Chart: 144 Years of Marriage and Divorce in the US

Dr. Randal S. Olson is a postdoctoral researcher at the University of Pennsylvania. He specializes in artificial intelligence, but is curious in other directions, including marriage. So he charted out the per capita number of marriages and divorces in the United States from the late 1860s to the present. You can find an interactive version of his chart here. It permits you to view data from individual years that Olson surveyed.
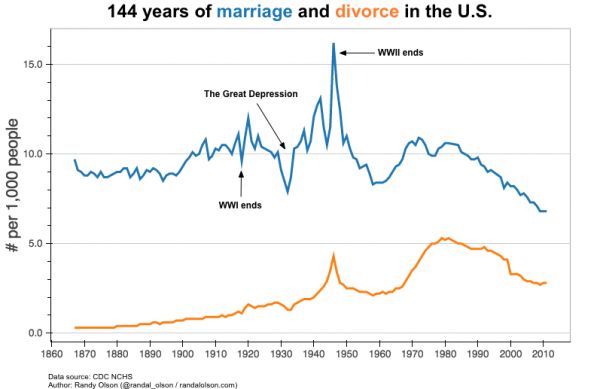
He notes that there are spikes in both marriage and divorce following World War II. That makes sense, as the stresses of the war could break apart marriages or prompt people who had delayed marriage for the war to get hitched promptly.
Marriage went into relative free fall during the Great Depression. But by the 1970s, it had become nearly universal. Now, Olson notes, the US has the lowest marriage rates since the Great Depression. Why do you think this is the case?

No comments: